Velocity: Measures the speed at which teams complete work.
Unleash Engineering Excellence
Boost Team Performance. Discover Observability for Engineering Teams with Engioscope
Unleash Engineering Excellence
Boost Team Performance. Discover Observability for Engineering Teams with Engioscope
Unleash Engineering Excellence
Boost Team Performance. Discover Observability for Engineering Teams with Engioscope
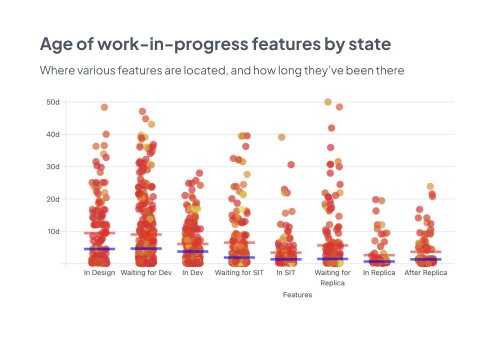
Why Engioscope?
Engioscope helps engineering teams focus on consistent, continuous, and early value delivery.
We provide the tools and metrics to avoid the 'Operation Successful, Patient Dead' scenario, ensuring that every project not only meets specifications but also delivers meaningful outcomes.
Learn More →We provide the tools and metrics to avoid the 'Operation Successful, Patient Dead' scenario, ensuring that every project not only meets specifications but also delivers meaningful outcomes.

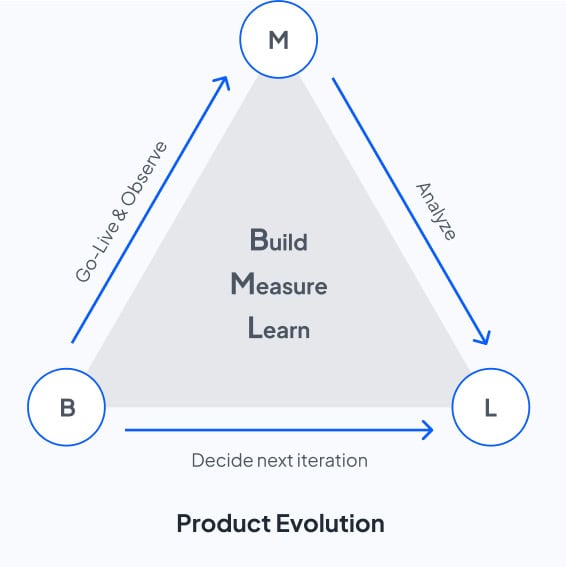
Image credit: Jeff Patton
Elevate Team Productivity with Comprehensive Flow and Health Insights
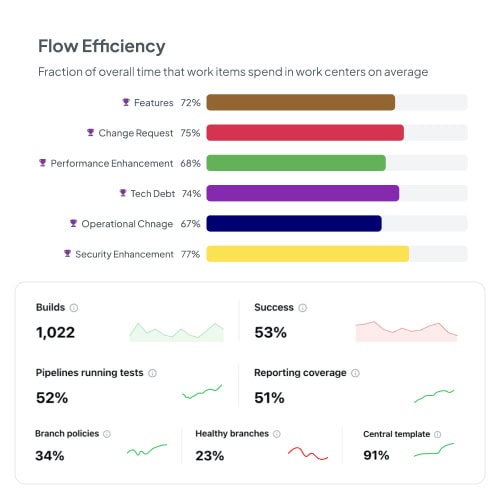
Combining flow and health metrics offers a comprehensive view of team productivity and engineering health. While flow metrics ensure the efficiency of value delivery, health metrics focus on the quality and adoption of engineering practices.
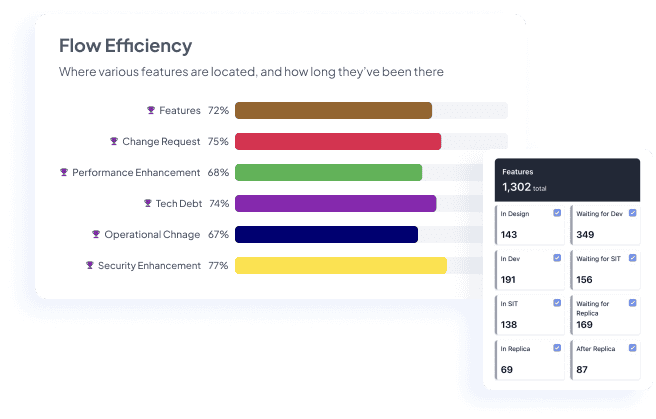
Flow Metrics - the big picture
Measure the flow of work through the system to identify inefficiencies and optimize the delivery process.
Scope
These metrics are influenced by many factors and generally reflect overall trends in the workflow, making them slow-moving and broad in scope.
These metrics are influenced by many factors and generally reflect overall trends in the workflow, making them slow-moving and broad in scope.
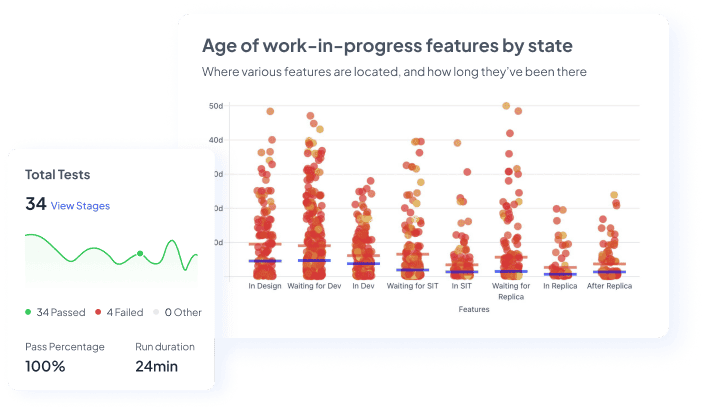
Health Metrics - the detailed view
Measure practice adoption and effectiveness within teams or projects, with detailed insights into specific aspects like test coverage.
Scope
These metrics are very focused on specific engineering practices and hence frequently changing, enabling teams to inspect and adapt.
These metrics are very focused on specific engineering practices and hence frequently changing, enabling teams to inspect and adapt.
Engioscope’s Core Capabilities
Unlock the potential of your engineering teams with tools and insights that drive real value.
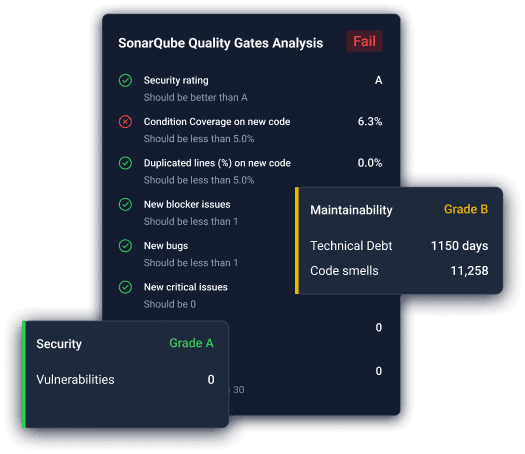
Elevate Code Standards
Dive into the heart of your project's codebase. Engioscope meticulously assesses code quality, utilizing integration with SonarQube for comprehensive code checks. Ensure your code meets the highest standards

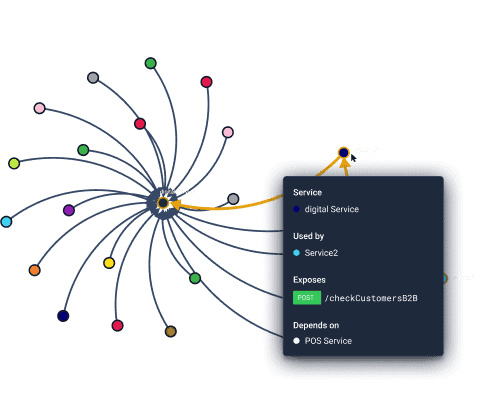
Visualize Service Dependency
Uncover the intricate web of service dependencies with our interactive graph. Hover over each node to reveal service names, details of exposures, and dependencies, providing a clear visualization of your project's architecture.

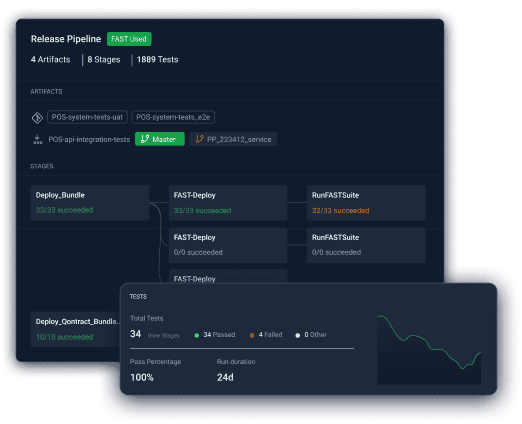
Streamlined Release Management
Effortlessly manage and track your release pipelines. Engioscope provides detailed information on artifacts, stages, and tests for each pipeline

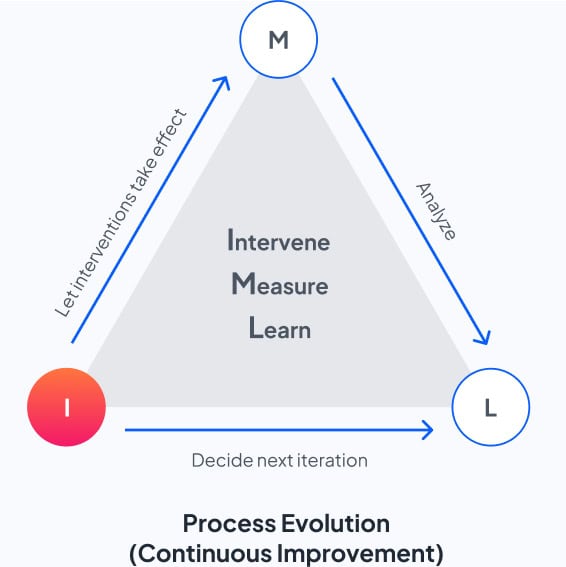
Continuous Improvement in Action
Engioscope offers a continuous monitoring framework that helps prioritize impactful areas and foster ongoing improvement.
